ESXi is pretty picky when it comes to time. A slight change to the time can have an interruptive effect on core systems functionality and monitoring.
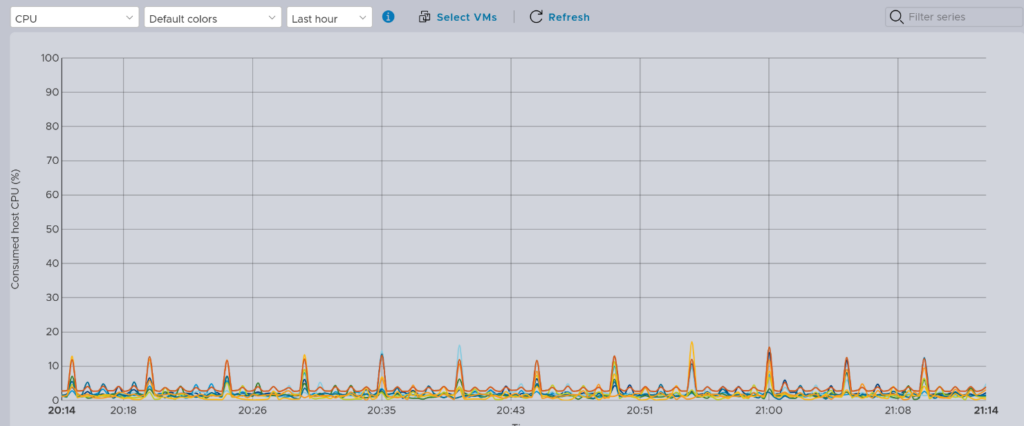
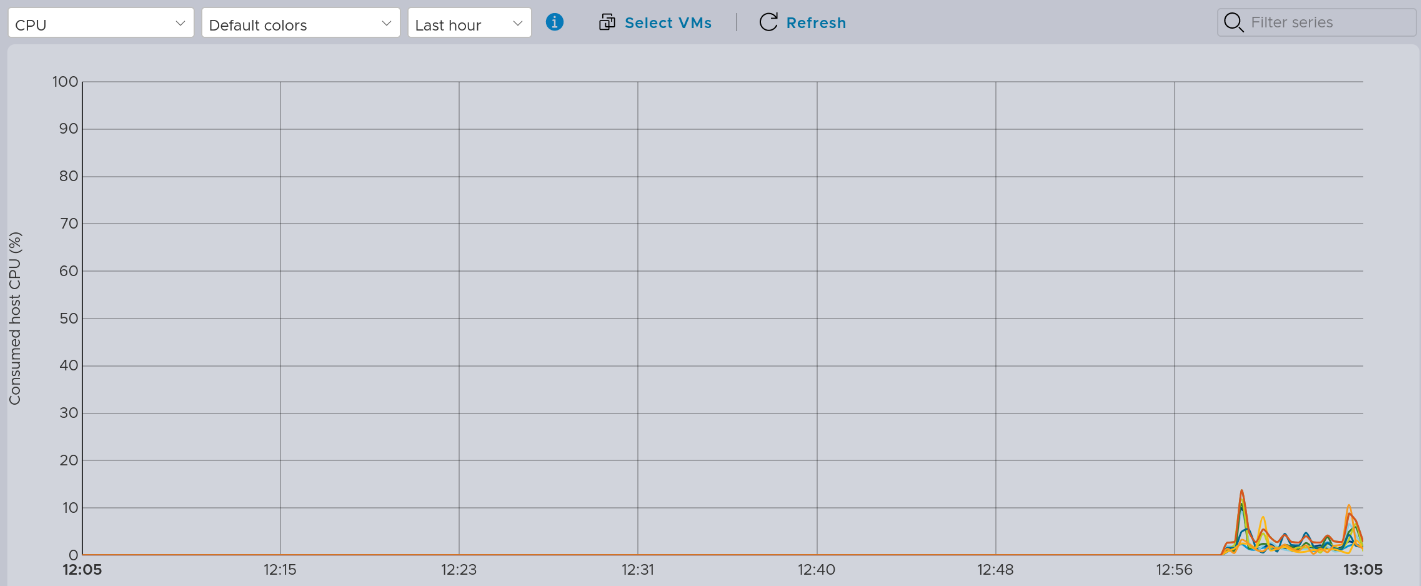
I encountered a real head scratcher when I noticed that the performance graphs appeared to be losing data and resetting fairly regularly – a few times an hour. This would be despite a reasonable uptime – anywhere from a couple of hours to weeks and months.
So I turned to the logs to try and understand if there was something happening to cause this behaviour. It didn’t take long to find a potential culprit:
...
2024-04-11T20:07:14.555Z Wa(180) vmkwarning: cpu5:1051409)WARNING: NTPClock: 1457: ntpd changed system clock to 1712866034.237264000, lost synchronization to upstream time servers
2024-04-11T20:07:14.237Z Wa(180) vmkwarning: cpu5:1051409)WARNING: NTPClock: 1771: system clock synchronized to upstream time servers
2024-04-11T20:26:50.972Z Wa(180) vmkwarning: cpu0:1051409)WARNING: NTPClock: 1457: ntpd changed system clock to 1712867210.447722000, lost synchronization to upstream time servers
2024-04-11T20:26:50.448Z Wa(180) vmkwarning: cpu0:1051409)WARNING: NTPClock: 1771: system clock synchronized to upstream time servers
...
There were quite a few occurrences of these messages. Let’s query the NTP status to get a bigger picture:
ntpq -pn
     remote           refid      st t when poll reach   delay   offset  jitter
==============================================================================
 192.168.255.1   110.232.114.22   3 u   65  128    7   22.211   +1.709   0.114
 192.168.255.2   150.101.186.50   2 u    7  128    7    0.121   -0.487   0.095
ntpq -c associations
ind assid status  conf reach auth condition  last_event cnt
===========================================================
  1 36528  9014   yes   yes  none    reject   reachable  1
  2 36529  9014   yes   yes  none    reject   reachable  1
Interesting (or frustrating, take your pick). The NTP service had resolved the NTP servers appropriately, though associations hadn’t been established (condition = reject).
Digging a little deeper (maybe too deep), there were no errors reported on the switch interface stats, and the interfaces had not flapped.
But wait, it had been working. There were no network changes to cause an interruption.
This lead to more questions:
- Why was the synchronisation being lost?
- Why would this cause the performance metrics to reset?
Looking at the vmkernel.log again, each time there was a sync loss event, it was followed by a sync event. Looking at the time stamp of the messages, I noticed something curious. The sync event was before the sync loss event. Each sync was ~400 milliseconds earlier.
If time was moving backwards by 400ms every time there was an NTP sync, did this explain why performance metrics were lost? Let’s test the theory. Let’s manually set the time forward by 1 minute. So far so good. Let’s now restart the NTP service. Ding. Resyncing the clock to correct the introduced 1 minute error resulted in a loss of performance data. This essentially answers the question of why performance metrics were being reset.
So what now? A couple more questions:
- We still have the question of why was sync was being lost.
- Why is the clock running fast?
- How do we fix it?
- Do we just discard NTP and avoid syncing issues?
Well firstly, no. We want to avoid turning off NTP. So many systems and functions rely on accurate time for effective operation.
Poking around /etc, I took a look at the ntp files. ntp.conf looked pretty standard and unremarkable. There’s also an ntp.drift file. Now this was interesting. This file is pretty simple; Just one line containing one number. But it’s the number that was of particular interest: 446.749. This is in the same ballpark of the difference in the timestamps from vmkernel.log. Could this be the golden ticket?
I’m no NTP expert, and a Google search for various permutations of ntp.drift (including esxi) didn’t yield too much of use. It’s possible I just didn’t hit the right search term. Despite this, I worked off the hypothesis that this file is used to accommodate for the natural deviation of the hardware clock frequency by adjusting it between NTP synchronisations. Checking other ESX hosts, the drift file indicated a lower figure – between 9 and 12ms. This seemed to support my theory. If the drift file was inaccurate, then it would explain why there was a deviation of ~400ms at each sync.
Time to put the theory to the test. The best way to do this would be to edit the drift file, setting the value to something in the order close to other ESX hosts (~9ms) and restart the NTP service.
So far, after 12 hours of operation, everything’s been solid. The sync loss events haven’t made a reappearance. The performance metrics haven’t been lost or reset. It appears we found and fixed the culprit. Presumably, the NTP drift file should be dynamic, so I’m not sure why it was so far out and not periodically assessed for accuracy. Maybe it’s a design feature, maybe a yet-to-be advised bug. For now though, we’ll leave it here. At least I don’t need to rebuild the system or retire the device.